London, 10 March 2026 – Canopius Group, a leading international Specialty and P&C (re)insurer, today announced its financial results for the year ended December 31, 2025.
Highlights include:
- Profit after tax increase of 16% to $467m (2024: $401m)
- Tangible Net Asset Value (TNAV) increase of 24% to $2.24 bn (2024: $1.81bn)
- Insurance Contract Written Premium (ICWP) increase of 27% to $4.48bn (2024: $3.53bn)
- Group net combined ratio (undiscounted) of 88.5% (2024: 90.2%)
- Return on Opening Tangible Equity (ROTE) of 25.8% (2024: 27.7%)
Neil Robertson, Group Chief Executive Officer, said: “2025 was a pivotal year for Canopius as we continue to evolve into a market leading underwriting company. We have delivered another year of strong performance with record profits. We are developing a consistent track record of profitability, evolving a successful strategy, and assembling a team that we believe will continue to deliver profitable growth and attractive returns for our shareholders.
“Building on this strong foundation, our strategy is to take an ambitious but disciplined approach to growing Canopius in the areas where we already have, or can have a distinctive, or competitive advantage.
“Our commitment to underwriting excellence, operational efficiency, and fostering a high-performing culture remains unwavering. As we look ahead, we will deliver sustainable growth, deepen our client partnerships, and continue to differentiate ourselves through practical innovation and our commitment to talent”.
Embedding a successful strategy in 2025
In 2024 we refreshed our strategy, our mission and our purpose, and we remain committed to the principles we set out then, with the central purpose being to help our clients be resilient in the face of their new and evolving threats and challenges. But strategy work is never done and as the environment has evolved, we have sharpened our focus and our approach.
In 2025, our strategic pillars have become our ‘North Star’ as we set out on our next three-year plan and as such there are several noteworthy strategic updates in support of this work:
- We have improved and solidified our market proposition; we have repositioned our underwriting portfolio towards higher quality and greater diversification, while refining our risk appetite and strengthening our balance sheet;
- We have built out an agile approach to embrace and utilise AI to support our strategy, mission, and purpose;
- We have built out our Talent Manifesto to ensure people and culture remain at the heart of our business. This is underpinned by the hugely encouraging results of our 2025 Employee Engagement Survey;
- We are leveraging data-driven analytics and portfolio management practices to enhance decision-making and execution; and
- We announced that we will be opening a permanent office in Manchester, UK in April 2026, where we will be designing new structures and processes that we need for the future in a new ‘Centre of Operational Excellence’.
In June, we announced that Samsung Fire & Marine Insurance (SFMI) increased its shareholding in the Canopius Group. Not only was this a significant investment, but it was a critical proof point and recognition of our talents and the quality of the team around the globe.
Our successful underwriting approach continues to deliver
During 2025, the Canopius Group has demonstrated the strength and versatility of our underwriting platforms, generating growth and profitability across the business.
Our premium increase of 27% in 2025 added to the substantial growth that we have seen in recent years and was once again strong by both product and geography. ICWP has now nearly doubled since 2022, increasing 96% over three years. Our attritional loss experience remains strong, with good accident year performance and positive prior year development.
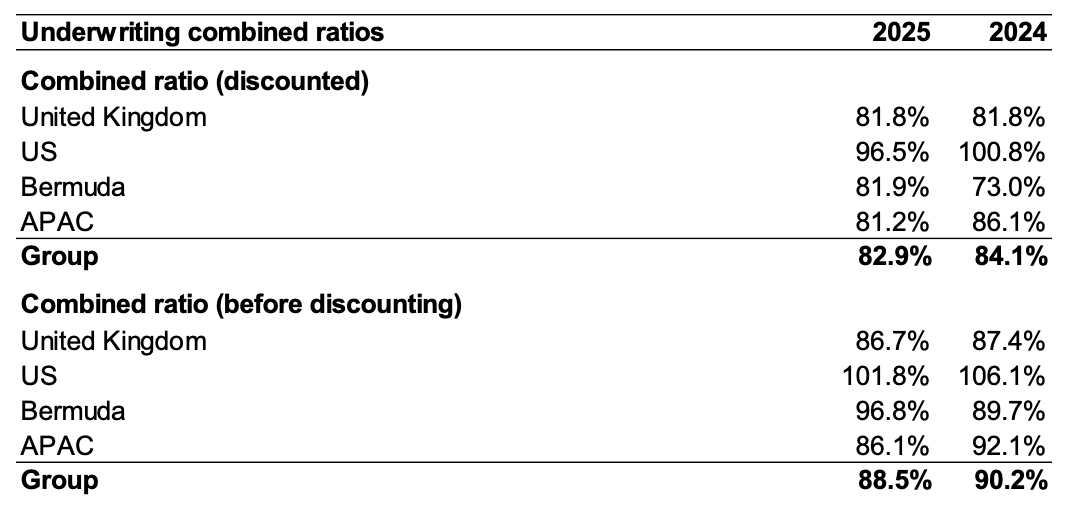
Our continued commercial success and underwriting discipline have again resulted in a record year of underwriting profitability with an undiscounted combined ratio of 88.5%. Our diverse portfolio continued to allow us to deliver growth and profitability, even through a period in which the rating environment remained challenging and the market continued to experience a myriad of loss activity, albeit with lower cat losses.
Demonstrating strong financial fundamentals
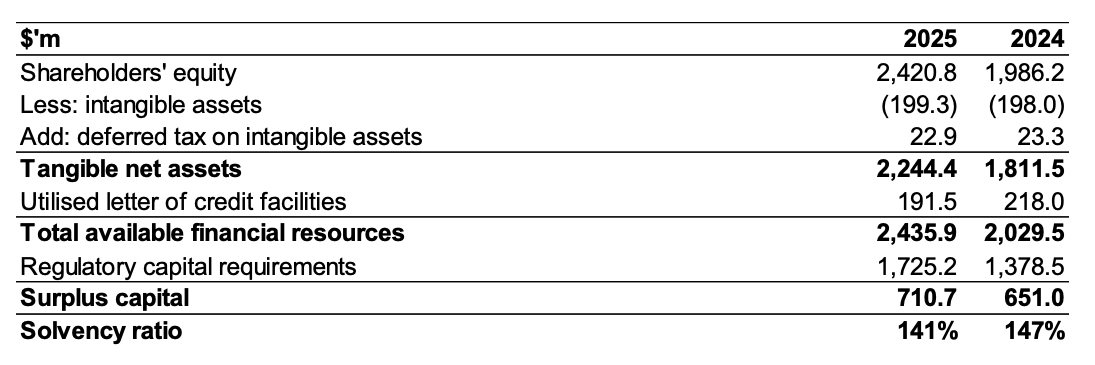
Our balance sheet is strong and has strengthened substantially again during the year, with tangible net assets growing by 24% to $2.24bn while our capital requirements have risen by 25%, proportionate to our balance sheet growth. Our capital surplus over our capital requirements has risen by 9% to $710.7m and continues to be robust. This provided resilience to adverse events as well as strategic optionality for capital deployment in both organic and inorganic initiatives as they arise.
Our reserving position is robust and has strengthened further during the year and we have limited legacy reserves (specifically back year US casualty liabilities) through the purchase of a loss portfolio transfer in 2021. In addition, we have an extremely high-quality and low risk investment portfolio which has yielded 4.9% in 2025.
Focusing on continued success
As we look to the future, we remain focused on our purpose: to help clients be resilient in the face of an evolving risk environment. The market in 2026 is set to continue to be dynamic and competitive, with volatility in loss trends and increasing competition for business. However, our disciplined approach, risk exposure diversity, winning culture, and commitment to practical innovation position us well to navigate these challenges.
As a result of the investment that we have made in our talent, technology, and operational excellence, Canopius is well placed to continue to develop both geographically and in our product suite, leveraging our established strengths and innovative capabilities.
We are committed to building a world-class underwriting company, with the best people and a winning culture that reflects our ambitions – a company that’s bold, balanced and built to last.
Group 2025 Financial Results commentary
Insurance Contract Written Premium (ICWP)
ICWP has grown by 27% in the year, with strong contributions across all our geographic segments.
The operating environment for our underwriters remains dynamic with an evolving rate environment as competition builds following strong industry results in recent years. Overall portfolio rate has generally been in line with our expectations but has been less favourable than in prior years. Despite this we have continued to deliver exceptional organic growth and underwriting discipline.
Rate was negative across the portfolio (-4.0% in 2025 vs +1.2% in 2024). While headline rate change fills a lot of press narrative, we continue to be focused on pricing adequacy.
Given the significant rate increases of recent years and the diversity of our exposures and capabilities, in spite of this evolving environment we have maintained positive rate adequacy across the portfolio in 2025.
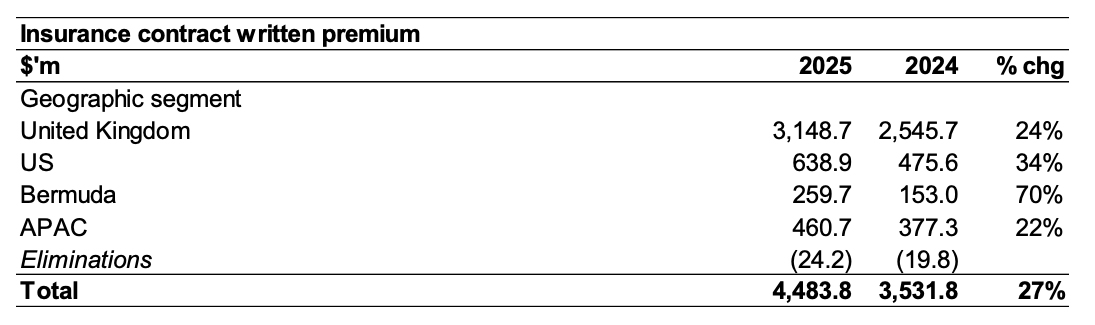
In the UK, we are particularly pleased once again to see strong organic growth rates, delivering the benefits of our diversified underwriting model. Portfolio Solutions had a strong year, with additional growth in our existing facilities and, towards the end of the year, we were appointed lead on a new facility with Willis Towers Watson. We have seen growth in Property D&F despite increased levels of competition and in Reinsurance. Specialty lines have been mixed, but attractive growth has been generated in Equine & Livestock, Accident & Health and Specie. Within Professional Lines, Financial lines remain challenging while, despite a very competitive environment for Cyber, we were still able to register double-digit growth rates.
In the US, strong growth was fuelled largely by Property D&F, reflecting strong demand and a still reasonable rate environment. We continue to deliver growth in our Auto and Cyber books, despite some challenges in highly competitive markets. Management and Professional lines remain challenged from a rate perspective and was reflected in more cautious premium growth.
We grew our Bermudan business, Canopius Re, across all lines of business but notably in Casualty reinsurance. We continue to take an opportunistic and measured approach to growing our Bermuda business, focusing on building a broad base of clients across diversified lines of business.
APAC grew strongly once again, attributable to a broad number of lines of business and territories. Engineering and Australian Casualty lines saw notable growth.
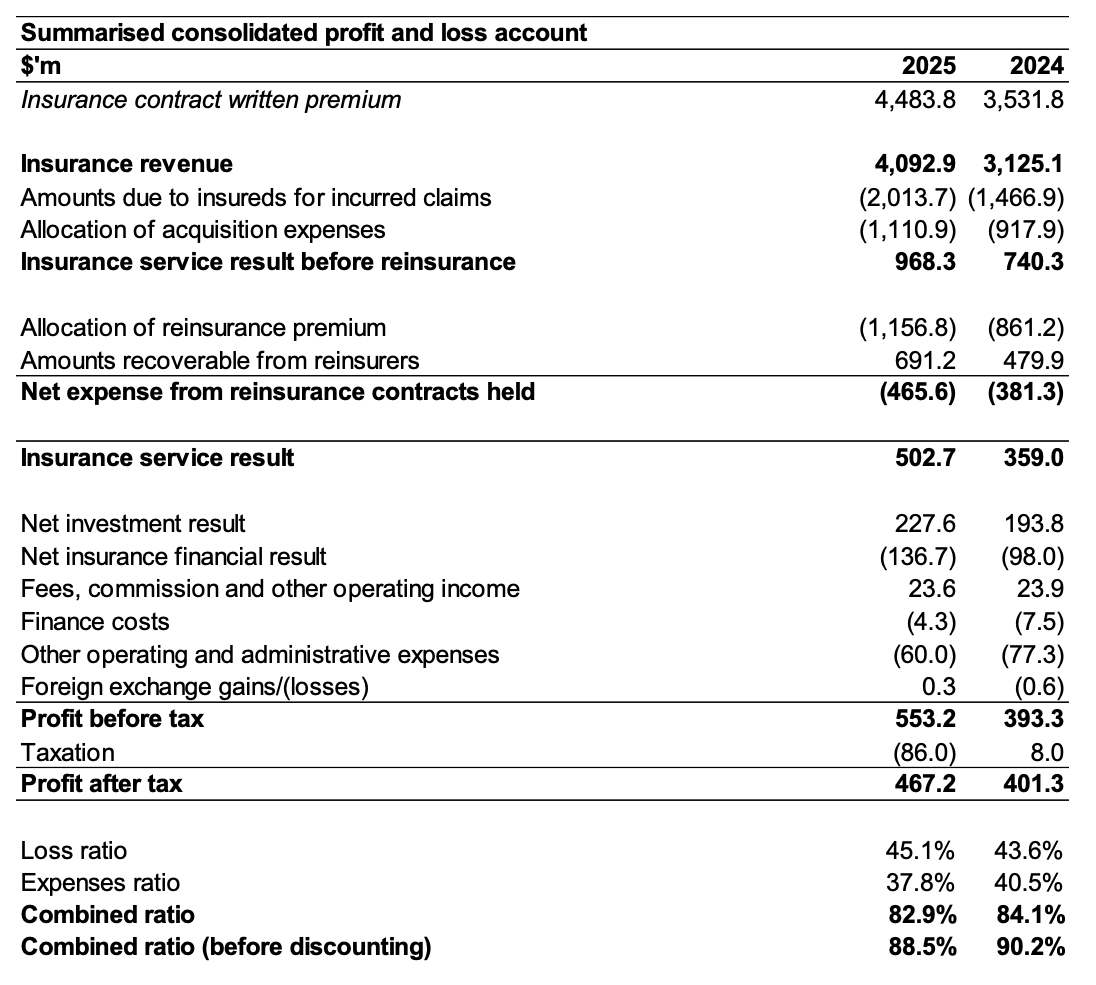
Net insurance revenue
Net insurance revenue amounted to $2,936.1m compared to prior year of $2,263.9m, a 30% increase year on year. The growth in net insurance revenue is mainly explained by the growth and rate changes described above under insurance contract written premiums, but also because of an extension of our Insurance whole account quota share with a high-quality group of reinsurers.
Insurance service expenses
Insurance service expenses capture claims incurred (net of discounting on current-year claims), acquisition costs and underwriting expenses incurred in the period.
Insurance service expenses of $3,124.6m compares to a prior-year amount of $2,384.8m. The 31% increase in 2025 reflects growth in the business at broadly stable overall net loss ratios.
After an above average year for large natural catastrophes in 2024, a quieter than normal North Atlantic hurricane season allowed for a lower catastrophe cost in 2025 (6.7% in 2025 vs 8.1% in 2024), despite the California Wildfires in the first quarter.
Our current year undiscounted non-cat loss ratio was 47.9% against 44.5% in the prior year. While this represents another strong result, the development versus 2024 reflects elevated loss activity in some areas and the challenges of an evolving rate environment.
The UK region was the best performer, with a non-cat loss ratio of 45.7%, despite higher non-cat loss activity, notably in Energy markets. It was another strong year in APAC, and Bermuda continued to perform well. The US region was affected by higher loss ratios in parts of the portfolio, specifically auto, but our performance demonstrates the diversity, depth and resilience of our business today which can accommodate volatility without derailing the Group result.
The 2024 and prior years have seen improvement in the year with some volatility across classes. Overall prior-year development benefited our undiscounted loss ratio by 3.9% compared to 3.0% in the previous year.
Expense levels were well controlled in 2025 and revenue growth generated meaningful operating leverage. Our acquisition expense ratio improved to 26.4% against 27.0% in the prior year mainly because of the growth in Portfolio Solutions. The underwriting expense ratio in 2025 fell to 11.4% compared to 13.5% in the prior year.
The benefit of discounting of 5.6% (2024: 6.1%) was lower than in 2024, due to lower interest rates more than offsetting a slight increase in our average liability duration. The volatility caused by discounting is out of an underwriter’s control and that is why we continue to utilise undiscounted combined ratios for our underwriting management.
Overall, we recorded a net combined ratio before discounting of 88.5% (2024: 90.2%) and a net combined ratio after discounting of 82.9% (2024: 84.1%).
Net investment result
In 2025 we generated $177.8m (2024: $149.8m) of regular investment income, amounting to an income yield of 3.9% (2024: 4.3%) in total. Income generated rose every quarter of the year, as our balance sheet continues to grow.
The total net investment result amounted to $227.6m (2024: $193.8m) net of expenses, representing a net investment return of 4.9% (2024: 5.4%). The total return benefited from some positive fair value gains as interest rates fell, resulting in some upward bond revaluations, and from some modest tightening of credit spreads
Insurance finance income/expense (IFIE)
The IFIE represents the unwind of the discount rate on the discounting of liabilities during the year and any fair value movements on the discounted liabilities because of discount rate changes.
The IFIE of $(136.7)m compares to the $(98.0)m in 2024. For 2025, the IFIE comprises $(115.8)m from the unwind of discounting (2024: $(95.6)m) and $(21.0)m resulting from changes in discount rates (2024: $(2.4)m). The higher unwind for the year is primarily the result of growth of the liabilities.
Other operating and administrative expenses
We consider most of our operating expenses to be related to our underwriting activities and these are included in our underwriting expense ratio. Other operating and administrative expenses are therefore group-related expenditure, and these decreased from $77.3m in 2024 to $60.0m, representing just 2.0% (relative to net insurance revenue) outside of the net combined ratio.
As explained in the prior year press release, included in other operating and administrative expenses for 2024 was a tax-related intercompany recharge of $27.2m from our ultimate UK tax resident parent entity, and this reduced to $2.2m in 2025. The underlying $8.0m year-on-year increase is a consequence of spending on strategic initiatives and the impact from additional short-term incentive plan costs from strong business performance.
Taxation
The Group tax charge of $86.0m compares to a tax credit of $8.0m in 2024. This represents an effective rate of 15.5% on pre-tax profits. We have now recognised deferred tax assets (DTAs) on all our historic brought forward losses, and like others, borne the implementation of a 15% Bermuda tax charge.
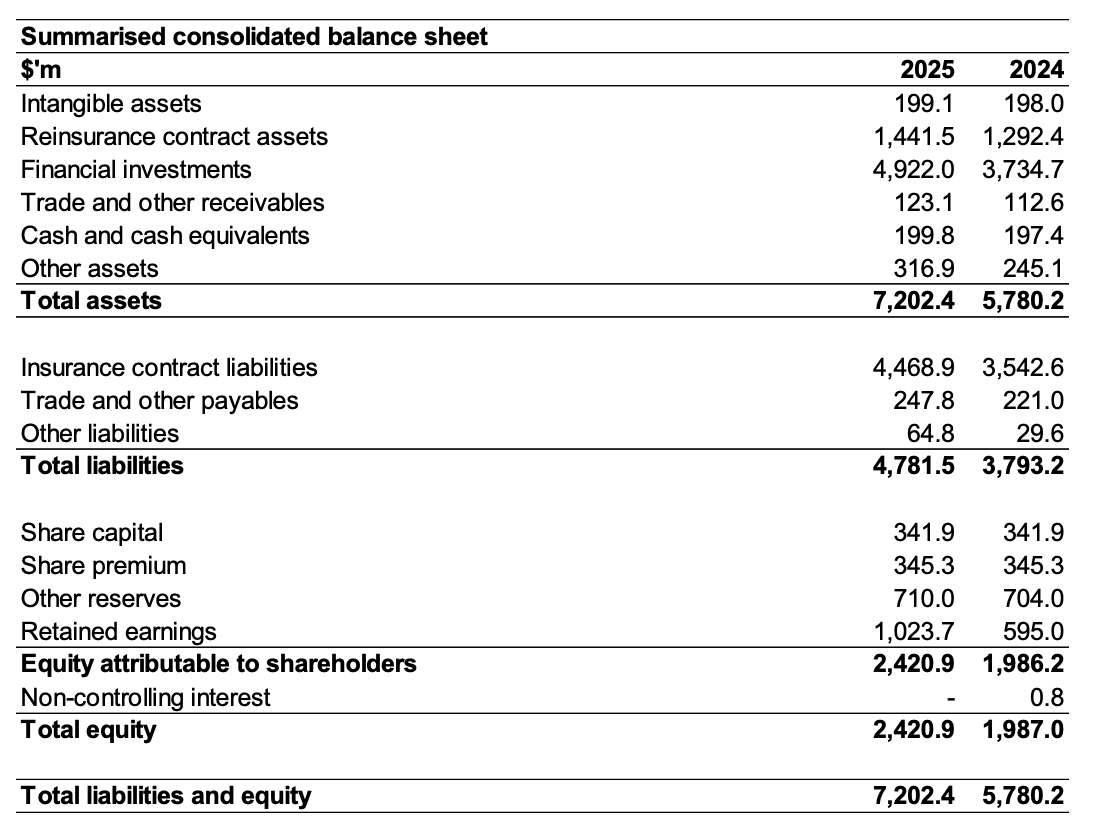
Balance sheet
As a result of the Group’s performance during the year, our balance sheet has strengthened further. Net assets have increased by 22% from $1,987.0m to $2,420.9m and tangible net asset value has increased by 24% from $1,811.5m to $2,244.4m. The strength of our balance sheet provides a robust foundation from which to achieve our ambitious business plans.
The strength of the balance sheet is underpinned by robust reserving processes and a well-resourced and skilled actuarial team. Our positive run-off against our loss picks supports the robustness of the prior year reserves. The confidence interval of the risk adjustment remains unchanged at the 75th percentile and our policy is to keep this within a range of +/- 2.5%. Our net risk adjustment has increased over the course of the year from $126.2m to $150.8m.
On the asset side of the balance sheet, the group remained defensively positioned with 90% (2024: 89%) of investment assets comprising cash, money market funds and core fixed income securities of extremely high quality. Once again, we experienced no credit defaults in our core fixed income portfolio. All our core assets are investment grade, while the total portfolio duration is now 1.3 years (2024: 1.2 years) to broadly match the sensitivity of assets and insurance contract liabilities to interest rate movements.
The Board manages the Group’s capitalisation to ensure that it is appropriate for all the regulatory and rating requirements associated with its medium-term management plan, including maintaining an appropriate amount of surplus for material adverse events and new business opportunities. The Group’s surplus capital is frequently monitored by the Board and is currently maintained at a level above that needed for our internal risk appetite and current regulatory and security rating requirements. This provides the surplus capital for us to deploy in a targeted and strategic way to accelerate our ambitions.
Most of our capital requirement is driven by the Economic Capital Assessment (“ECA”) at Lloyd’s, which itself is set by Lloyd’s as 135% of the ultimate Solvency Capital Requirement (“uSCR”). The uSCR takes account of one year’s new business in full, attaching to the next underwriting year, and the risks over the lifetime of the liabilities assessed at a 1:200 confidence level (99.5% percentile). The capital requirement of our US balance sheet business is assessed against the US Risk Based Capital (“RBC”) requirements and our Bermuda business is assessed against the Bermuda Solvency Capital Requirement (“BSCR”).
As we are not regulated at a Group level, we do not prepare a Solvency Capital Requirement (“SCR”) under Solvency II, as many other companies in Europe do. However, the uSCR is more conservative than a one-year Solvency II SCR due to it taking account of all new business and the risks over the lifetime of the liabilities. In addition, as was noted above, the Lloyd’s ECA is also 135% of this more conservative uSCR.
The Group’s capital requirements at 31 December 2025 under the above bases were $1,725.2m (2024: $1,378.5m). This 25% increase is proportionate to the growth in the Group’s balance sheet and less than the growth in our premium base, primarily because of increased diversification.
The Group defines its financial resources as the consolidated tangible net asset value of the Group and the utilised portion of its letter of credit (LOC) facility. Due to our strong cash flows we have chosen not to fully utilise our LOC capacity. While this means that our surplus over regulatory requirements shows only a relatively small increase over the prior year at $710.7m (2024: $651.0m), we could increase that surplus should we choose to do so. The substantial surplus is considerably in excess of rating agency capitalisation demands at our rating level, providing resilience as well as strategic optionality.
Sale of Vave
Vave is a “home grown” algorithmic MGA underwriter in the US Excess and Surplus Lines market. During 2025 we engaged in proceedings to sell 100% of Vave and on 9th December we signed definitive agreements to sell Vave to Acrisure. Separation work is now ongoing, and the sale is expected to close in early Q2 2026.
As Vave was under Canopius ownership for the entirety of 2025, its results continue to be fully consolidated into our Group numbers as they have done historically. However, the net asset value is shown as an asset held for sale in our year-end balance sheet, presented at “cost”.
Net proceeds and associated profit arising from the sale will be booked in 2026 upon close of the transaction.